Follow the Data, Find the Story: Discovery of Multidirectional Stories in the Digital Archive
By
A Miller
September 2017
¶ 1Leave a comment on paragraph 1 0
What is data? How can it tell a story? Data can be represented through numbers, text, and images, and perhaps offer enough detail on its own to derive a singular story of that data. But when that data is collectively managed and preserved by a library’s publishing program, multiple collections of data sets become searchable in the digital library and on the web. This enables a way to unfold stories that may not have been explored without the interconnections among the library’s digital collections.
¶ 2Leave a comment on paragraph 2 0Figure 1. The bar chart shows the number of items per digital-publishing platform. Created by author.
¶ 3Leave a comment on paragraph 3 0
The connected data in the digital library at Middle Tennessee State University (MTSU) offers an example of what stories emerge from such an interoperable framework, and of how attention to usage data might inspire rich data stories. MTSU’s Walker Library has curated over twenty-three digital collections, which have over 10,000 items researched, organized, and united in its CONTENTdm database, complete with descriptive metadata. However, these twenty-three collections are only a fraction of the data preserved by the library. The library also publishes textual scholarship including journals, whose editorial boards are MTSU faculty or students, hosted by the library in an Open Journal Systems platform. Another library platform, the institutional repository (IR) JEWLScholar, publishes the scholarship of MTSU faculty, students, and alumni, including articles, presentations, student publications, department newsletters, posters, presentations, and electronic theses and dissertations.
¶ 4Leave a comment on paragraph 4 0
Together, these last two text-based collections (although some include multimedia elements) forge a collection of 5,378 items to date. The majority, a collection of 4,800 items, is found in the IR, has reached a half-million downloads, and has been searched over one-million times. This data, including the statistical usage data, only tells a surface story, the first layer of the data. Although this particular surface story presents a useful narrative, especially for reporting and marketing purposes, it is merely the jumping-off point for a multidirectional set of story possibilities that unfold as data discoveries are driven inward and data points are layered, connected, and explored. This process is enabled by the technical infrastructure of the library’s publishing and preservation program.
¶ 5Leave a comment on paragraph 5 0Figure 2. The bubble chart shows both the collection theme and item count for collections in the CONTENTdm publishing platform; the size of the bubble reflects the size of the collection. Created and analyzed by author.
¶ 6Leave a comment on paragraph 6 0Figure 3. The pie chart shows the collection themes and relative size of items in the IR publishing platform. Sidelines is included within the “Student Publications” collection. Created by author.
¶ 7Leave a comment on paragraph 7 0
Looking at the contents of the three digital platforms mentioned above, the library is collectively creating, preserving, and sustaining over 16,000 items and their data. Upon looking deeper, it was discovered that the MTSU student newspaper, Sidelines, is located in both the CONTENTdm and IR platforms.
¶ 8Leave a comment on paragraph 8 0
Of the 10,430 items in CONTENTdm, 3,080 of those items are from the Sidelines collection. Similarly, with the IR items, there are 3, 355 items (issues of the daily newspaper) equating to 74 percent of the 10,800 items in the entire IR. Given that use of the IR has increased dramatically since it was launched in 2014, it is no surprise that its holdings not only increase by item count but also by bitstream views for each item (number of downloads). Of all 10,800 items in the IR, a deeper look at the top 100 most viewed shows a range of 294-1,209 views each as of September 20, 2016. This is represented in the treemap (Figure 4), where the color shows details about the collection, the text indicates the unit of the collection, and the size of the boxes shows the sum of total views. Again, here we see Sidelines statistics ahead of other collections. As the treemap illustrates, the Sidelines student newspaper and another student-produced collection, the Electronic Theses and Dissertations (ETD) collection represented in yellow, are among the largest in the IR. What does this mean? You can interpret this many ways, but for one, MTSU students not only produce creative (newspaper) and academic publications (theses/dissertation), but they are among the most-viewed items in the IR.
¶ 9Leave a comment on paragraph 9 0Figure 4. The treemap shows the top 100 IR downloads broken down by color for collection theme and box size for number of items in that collection. Created and analyzed by author.
¶ 11Leave a comment on paragraph 11 0Figure 5. Partial image of the 1950 Sidelines issue that ranked 12th in the top 100 downloads for the IR.
¶ 12Leave a comment on paragraph 12 0
This surface story of use can inspire further exploration, for example, of some of the most-viewed Sidelines issues. Of the top 100 most-viewed items in the IR, twenty-four are Sidelines issues that have been viewed a total of 10,395 times. All 100 most-viewed items have been viewed collectively 43,444 times, at the time this article was written. Therefore, 23.9 percent of those totals views have been of Sidelines issues. With 585 total views, ranking at number twelve of the top 100, is the September 20, 1950 Sidelines issue (see Figure 5).1
¶ 13Leave a comment on paragraph 13 0Figure 6. Partial image of the 1949 Sidelines issue that ranked 14th in the top 100 downloads for the IR.
¶ 14Leave a comment on paragraph 14 0
The second most-viewed issue is from April 27, 1949 (ranked fourteen of top 100) with 559 total views.2 In this issue, MTSU (then called Middle Tennessee State College) had a feature story of its largest graduating class: 192! Compare that to spring 2016, when 2,383 students graduated,3 and you can see the start of another story of MTSU history unfolding.
¶ 15Leave a comment on paragraph 15 0
The third most-viewed issue is from March 8, 1950 (ranked fifteen of top 100) with twenty-seven total views.4 Looking at news stories by student journalists over sixty years ago makes one reflect upon that time period. But newspaper issues that are preserved like this can offer even more. Looking at just a few of the advertisements in this issue shows the type of businesses and activities that were popular in 1950’s Murfreesboro. For instance, there is an ad for Andrew’s Café and its address. A search for that address today shows it has been taken over by Country Gourmet, a specialty shop located on the public square in downtown Murfreesboro. It makes you wonder how many other shops occupied that spot on the square between 1950 and 2016.
¶ 17Leave a comment on paragraph 17 0
If they read the April 27, 1949, issue, would locals recognize the ad for the Buchanan and Tarpley Drugstore? In the 1930s and 1940s, the drug store’s soda fountain made it an attraction for the town square before it later closed in the 1980s (it was also known as Moudy’s Drugs).5 That same drugstore ad is also in Midlander, the student-produced yearbook. (You can see this ad by navigating to the Midlander collection and locating page 144 of the 1950 Midlander issue available at http://dsi.mtsu.edu/collections.) In fact, searching for “Buchanan and Tarpley” within that Midlander collection yields reference to the drug store in twenty yearbook issues. How much do you think advertising cost then? Taking data from the advertisements as an example of a surface story can lead to uncovering a multidirectional story based on where the researcher goes next with this data, which could be advertising costs or type of advertisements used in certain time periods. This can prompt inquiries on how or why those advertisements were selected, or whether there were familial or professional ties, which can lead to a deeper study of prominent names in local business or donors to the local college. The multidirectional story here has endless possibilities, depending on the reader’s interests.
¶ 19Leave a comment on paragraph 19 0
Another example of a multidirectional story unfolding from this library data similarly involves tracking a data point across collections. For instance, if you were interested in knowing whether the Sidelines newspaper had an impact on student theses or dissertations, you would simply search for “Sidelines” in the Theses and Dissertations collection. That search yields thirty-one references to the Sidelines newspaper being used in students’ culminating theses or dissertations. Not only is the MTSU newspaper written by students, but others can create their own multidirectional stories by reusing it in their own research. Because the newspaper is archived and preserved by the library, future generations can continue to do the same.
¶ 20Leave a comment on paragraph 20 0
Needless to say, this is only a fraction of the data housed in the library’s collections. In three digital platforms, with over 16,000 items and multiple layers of descriptive data, there are quite a few stories to tell, retell, and discover for the first time. The technical infrastructure of the digital library, the interoperability of the library publishing platforms, and the connected data provide the connections needed for multidirectional stories. Preserving original stories of the past is the foundation, and connecting the collections of archived data not only makes the surface story available to the public but it also enables deeper data connections across and within other collections. It is an endless feed of multidirectional story possibilities just waiting for an author or researcher. And not only are the stories being told, they are being read worldwide.
¶ 21Leave a comment on paragraph 21 0
But it is obvious that the student-produced newspaper and yearbook have not only had a profound impact on collection counts but also user views, as one of the digital library’s most-viewed collections. Thanks to the hard work of student journalists reporting on local news, listing graduating class sizes, and advertising popular events and establishments, these stories can still be told and rediscovered today. This historical data can be shared with the public because the library’s mission is to preserve and archive the scholarship of the university. As a result, surface stories of the past contribute to multidirectional stories waiting to be discovered. All institutions with similarly archived collections in an interoperable framework can document the histories of its community and pave the way for future stories: follow the data and find your own story.
Follow the Data, Find the Story: Discovery of Multidirectional Stories in the Digital Archive
By A Miller
September 2017
¶ 1 Leave a comment on paragraph 1 0 What is data? How can it tell a story? Data can be represented through numbers, text, and images, and perhaps offer enough detail on its own to derive a singular story of that data. But when that data is collectively managed and preserved by a library’s publishing program, multiple collections of data sets become searchable in the digital library and on the web. This enables a way to unfold stories that may not have been explored without the interconnections among the library’s digital collections.
¶ 2 Leave a comment on paragraph 2 0 Figure 1. The bar chart shows the number of items per digital-publishing platform. Created by author.
¶ 3 Leave a comment on paragraph 3 0 The connected data in the digital library at Middle Tennessee State University (MTSU) offers an example of what stories emerge from such an interoperable framework, and of how attention to usage data might inspire rich data stories. MTSU’s Walker Library has curated over twenty-three digital collections, which have over 10,000 items researched, organized, and united in its CONTENTdm database, complete with descriptive metadata. However, these twenty-three collections are only a fraction of the data preserved by the library. The library also publishes textual scholarship including journals, whose editorial boards are MTSU faculty or students, hosted by the library in an Open Journal Systems platform. Another library platform, the institutional repository (IR) JEWLScholar, publishes the scholarship of MTSU faculty, students, and alumni, including articles, presentations, student publications, department newsletters, posters, presentations, and electronic theses and dissertations.
¶ 4 Leave a comment on paragraph 4 0 Together, these last two text-based collections (although some include multimedia elements) forge a collection of 5,378 items to date. The majority, a collection of 4,800 items, is found in the IR, has reached a half-million downloads, and has been searched over one-million times. This data, including the statistical usage data, only tells a surface story, the first layer of the data. Although this particular surface story presents a useful narrative, especially for reporting and marketing purposes, it is merely the jumping-off point for a multidirectional set of story possibilities that unfold as data discoveries are driven inward and data points are layered, connected, and explored. This process is enabled by the technical infrastructure of the library’s publishing and preservation program.
¶ 5 Leave a comment on paragraph 5 0 Figure 2. The bubble chart shows both the collection theme and item count for collections in the CONTENTdm publishing platform; the size of the bubble reflects the size of the collection. Created and analyzed by author.
¶ 6 Leave a comment on paragraph 6 0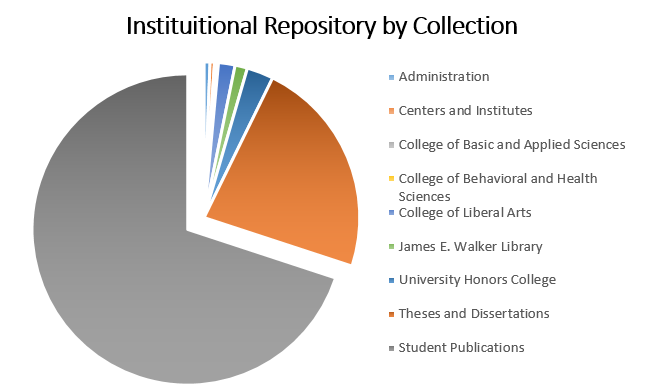 Figure 3. The pie chart shows the collection themes and relative size of items in the IR publishing platform. Sidelines is included within the “Student Publications” collection. Created by author.
¶ 7 Leave a comment on paragraph 7 0 Looking at the contents of the three digital platforms mentioned above, the library is collectively creating, preserving, and sustaining over 16,000 items and their data. Upon looking deeper, it was discovered that the MTSU student newspaper, Sidelines, is located in both the CONTENTdm and IR platforms.
¶ 8 Leave a comment on paragraph 8 0 Of the 10,430 items in CONTENTdm, 3,080 of those items are from the Sidelines collection. Similarly, with the IR items, there are 3, 355 items (issues of the daily newspaper) equating to 74 percent of the 10,800 items in the entire IR. Given that use of the IR has increased dramatically since it was launched in 2014, it is no surprise that its holdings not only increase by item count but also by bitstream views for each item (number of downloads). Of all 10,800 items in the IR, a deeper look at the top 100 most viewed shows a range of 294-1,209 views each as of September 20, 2016. This is represented in the treemap (Figure 4), where the color shows details about the collection, the text indicates the unit of the collection, and the size of the boxes shows the sum of total views. Again, here we see Sidelines statistics ahead of other collections. As the treemap illustrates, the Sidelines student newspaper and another student-produced collection, the Electronic Theses and Dissertations (ETD) collection represented in yellow, are among the largest in the IR. What does this mean? You can interpret this many ways, but for one, MTSU students not only produce creative (newspaper) and academic publications (theses/dissertation), but they are among the most-viewed items in the IR.
¶ 9 Leave a comment on paragraph 9 0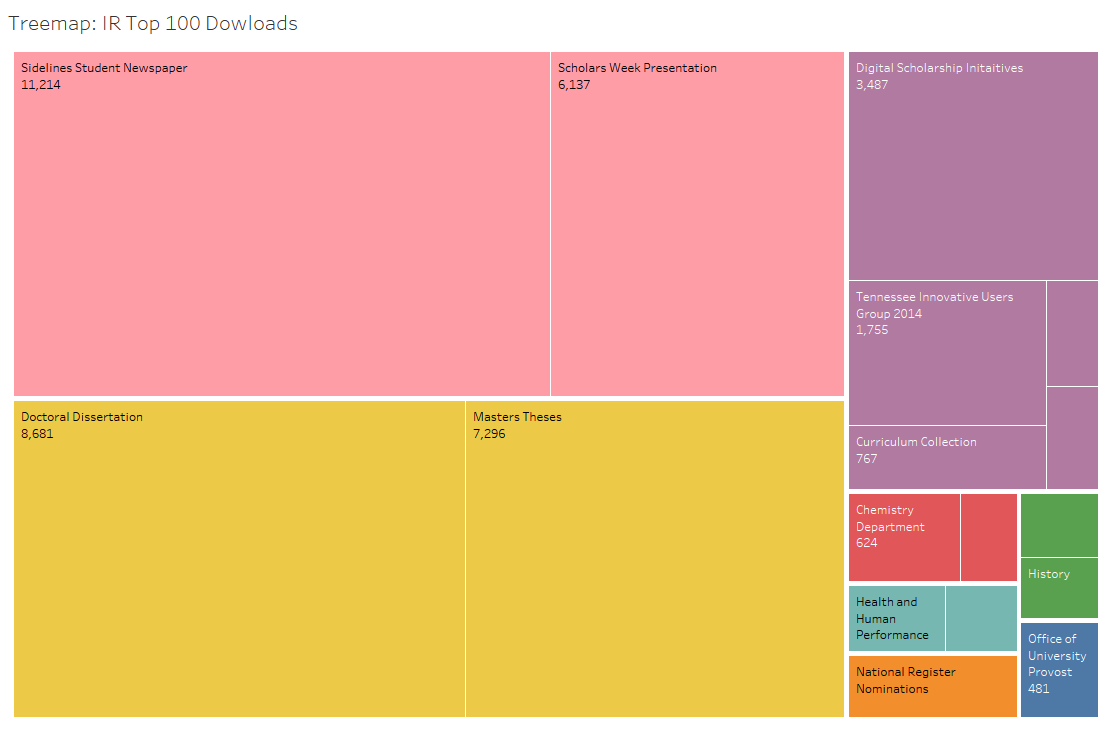 Figure 4. The treemap shows the top 100 IR downloads broken down by color for collection theme and box size for number of items in that collection. Created and analyzed by author.
¶ 10 Leave a comment on paragraph 10 0
¶ 11 Leave a comment on paragraph 11 0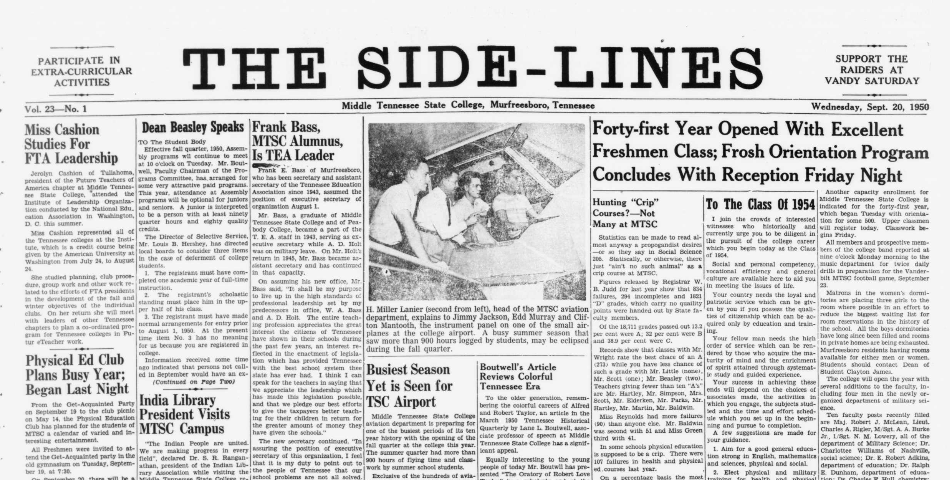 Figure 5. Partial image of the 1950 Sidelines issue that ranked 12th in the top 100 downloads for the IR.
¶ 12 Leave a comment on paragraph 12 0 This surface story of use can inspire further exploration, for example, of some of the most-viewed Sidelines issues. Of the top 100 most-viewed items in the IR, twenty-four are Sidelines issues that have been viewed a total of 10,395 times. All 100 most-viewed items have been viewed collectively 43,444 times, at the time this article was written. Therefore, 23.9 percent of those totals views have been of Sidelines issues. With 585 total views, ranking at number twelve of the top 100, is the September 20, 1950 Sidelines issue (see Figure 5).1
¶ 13 Leave a comment on paragraph 13 0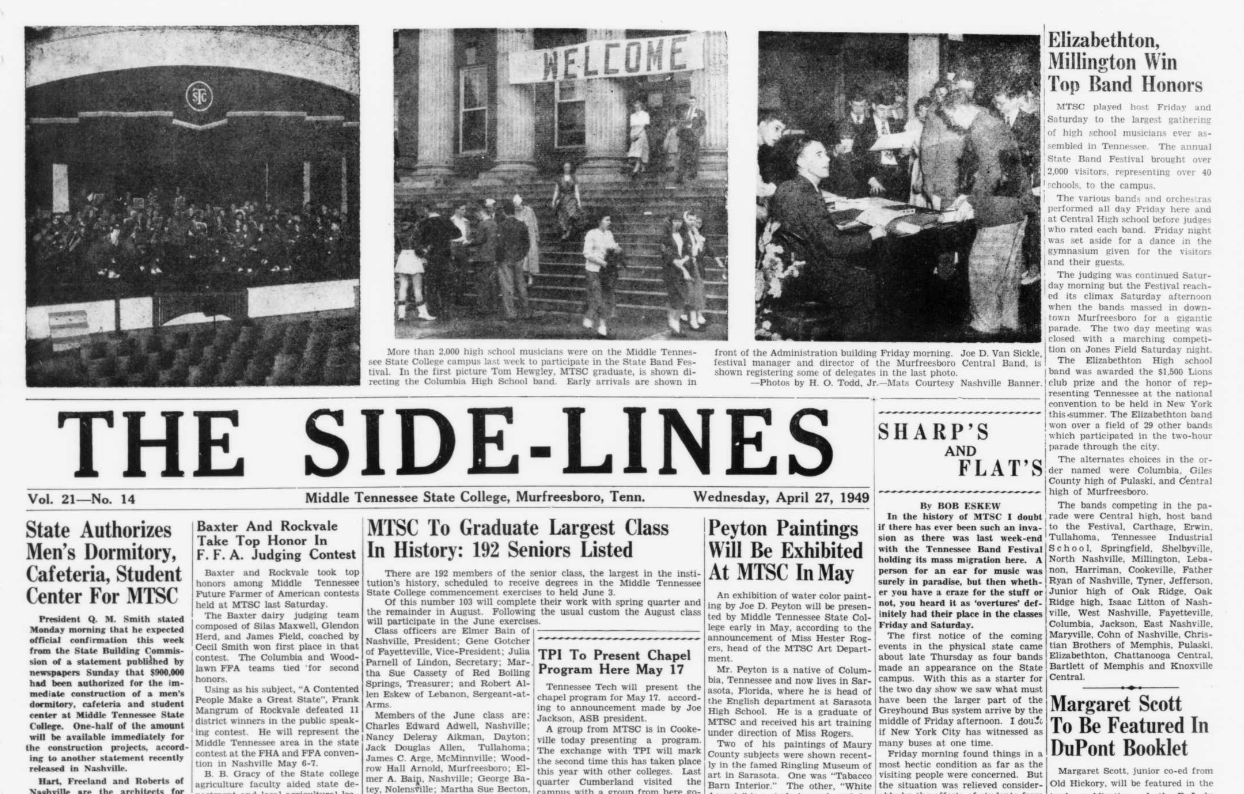 Figure 6. Partial image of the 1949 Sidelines issue that ranked 14th in the top 100 downloads for the IR.
¶ 14 Leave a comment on paragraph 14 0 The second most-viewed issue is from April 27, 1949 (ranked fourteen of top 100) with 559 total views.2 In this issue, MTSU (then called Middle Tennessee State College) had a feature story of its largest graduating class: 192! Compare that to spring 2016, when 2,383 students graduated,3 and you can see the start of another story of MTSU history unfolding.
¶ 15 Leave a comment on paragraph 15 0 The third most-viewed issue is from March 8, 1950 (ranked fifteen of top 100) with twenty-seven total views.4 Looking at news stories by student journalists over sixty years ago makes one reflect upon that time period. But newspaper issues that are preserved like this can offer even more. Looking at just a few of the advertisements in this issue shows the type of businesses and activities that were popular in 1950’s Murfreesboro. For instance, there is an ad for Andrew’s Café and its address. A search for that address today shows it has been taken over by Country Gourmet, a specialty shop located on the public square in downtown Murfreesboro. It makes you wonder how many other shops occupied that spot on the square between 1950 and 2016.
¶ 16 Leave a comment on paragraph 16 0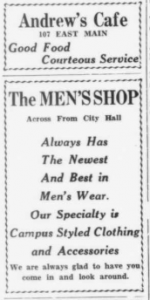 Figure 7. Advertisement from the March 8, 1950 Sidelines issue.
¶ 17 Leave a comment on paragraph 17 0 If they read the April 27, 1949, issue, would locals recognize the ad for the Buchanan and Tarpley Drugstore? In the 1930s and 1940s, the drug store’s soda fountain made it an attraction for the town square before it later closed in the 1980s (it was also known as Moudy’s Drugs).5 That same drugstore ad is also in Midlander, the student-produced yearbook. (You can see this ad by navigating to the Midlander collection and locating page 144 of the 1950 Midlander issue available at http://dsi.mtsu.edu/collections.) In fact, searching for “Buchanan and Tarpley” within that Midlander collection yields reference to the drug store in twenty yearbook issues. How much do you think advertising cost then? Taking data from the advertisements as an example of a surface story can lead to uncovering a multidirectional story based on where the researcher goes next with this data, which could be advertising costs or type of advertisements used in certain time periods. This can prompt inquiries on how or why those advertisements were selected, or whether there were familial or professional ties, which can lead to a deeper study of prominent names in local business or donors to the local college. The multidirectional story here has endless possibilities, depending on the reader’s interests.
¶ 18 Leave a comment on paragraph 18 0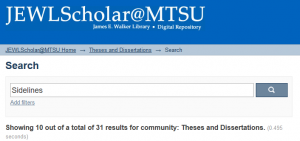 Figure 8. Search results for Sidelines in the IR, JEWLScholar.
¶ 19 Leave a comment on paragraph 19 0 Another example of a multidirectional story unfolding from this library data similarly involves tracking a data point across collections. For instance, if you were interested in knowing whether the Sidelines newspaper had an impact on student theses or dissertations, you would simply search for “Sidelines” in the Theses and Dissertations collection. That search yields thirty-one references to the Sidelines newspaper being used in students’ culminating theses or dissertations. Not only is the MTSU newspaper written by students, but others can create their own multidirectional stories by reusing it in their own research. Because the newspaper is archived and preserved by the library, future generations can continue to do the same.
¶ 20 Leave a comment on paragraph 20 0 Needless to say, this is only a fraction of the data housed in the library’s collections. In three digital platforms, with over 16,000 items and multiple layers of descriptive data, there are quite a few stories to tell, retell, and discover for the first time. The technical infrastructure of the digital library, the interoperability of the library publishing platforms, and the connected data provide the connections needed for multidirectional stories. Preserving original stories of the past is the foundation, and connecting the collections of archived data not only makes the surface story available to the public but it also enables deeper data connections across and within other collections. It is an endless feed of multidirectional story possibilities just waiting for an author or researcher. And not only are the stories being told, they are being read worldwide.
¶ 21 Leave a comment on paragraph 21 0 But it is obvious that the student-produced newspaper and yearbook have not only had a profound impact on collection counts but also user views, as one of the digital library’s most-viewed collections. Thanks to the hard work of student journalists reporting on local news, listing graduating class sizes, and advertising popular events and establishments, these stories can still be told and rediscovered today. This historical data can be shared with the public because the library’s mission is to preserve and archive the scholarship of the university. As a result, surface stories of the past contribute to multidirectional stories waiting to be discovered. All institutions with similarly archived collections in an interoperable framework can document the histories of its community and pave the way for future stories: follow the data and find your own story.
¶ 22 Leave a comment on paragraph 22 0
A Miller
Digital Scholarship Librarian – Middle Tennessee State University
Footnotes
License
This work is licensed under a Creative Commons Attribution-NonCommercial 4.0 International License.
Share